Economic Figures & Statistics
COMMERCE, TRADE AND INDUSTRY
Number of Business Establishment for the past Six Years CY 2015-2020
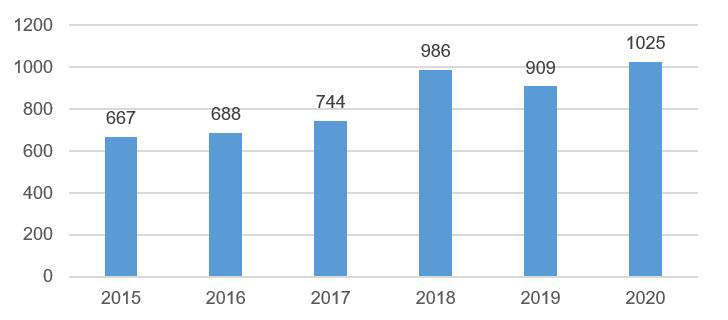
Commerce, trade and industry sector plays a vital role in the economic development of Tangub City as it contributes to poverty reduction by creating jobs for the city's growing labor force. Its annual growth rate from 2015 to 2020 represents the city’s thriving and growing economy. There are 1,025 registered business establishments in the city in the year 2020 which is 12.76% higher compared to 909 in the year 2019. Its growth is due to the growth of industries engaged in wholesale and retail trade, repair services, accommodation and food services and financial and insurance activities. These industries accounted for about 48.78% of the total number of business establishments.
Commercial & Industrial Available Area
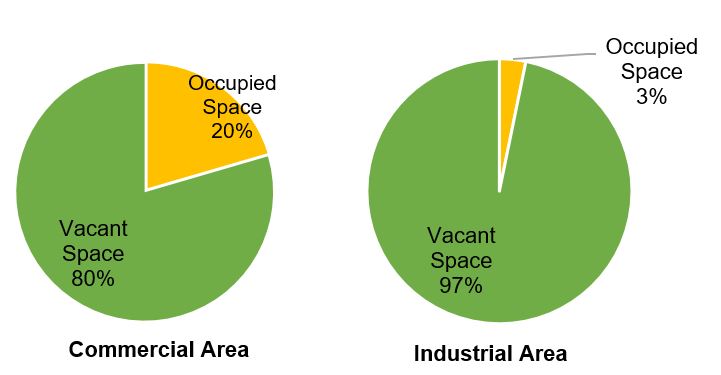
The city identified an approximate total vacant space for commercial use of about 357.6 hectares or 80% of the total area for commercial zone (449.75 has). For industrial development, a total of 237.2 hectares or 97% is identified available space for preferred investors.
AGRICULTURE
Crops Volume of Production (fruits and vegetables) 2018 – 2019
| Year | Volume of Production (MT) |
| 2018 | 47,505.18 |
| 2019 | 47,987.00 |
Volume of production of crops such as rice, corn, coconut, banana, mango, rambutan, durian, lanzones, papaya, pomelo, ube, ginger, sweet potato, tomato, pechay, squash, okra, cassava, bitter melon, cabbage, stringbeans, mongo and carrots increased by 1.01 % in 2019 from the total volume of production in 2018.
Crops Volume of Production (rice, corn, coconut and banana), 2018 – 2019
| Year | Volume of Production (MT) |
| 2018 | 40, 719.14 |
| 2019 | 41,163.00 |
Volume of production of major crops such as rice, corn, coconut and banana increased by 1.09 % in 2019 from the total volume of production in 2018.
TOURISM
Comparative Data on Annual Number of Visitors
In 2019, the total number of visitors recorded was 38.33% lower than the previous year's record. Decreases in the number of visitors were due to election ban and to facilities that were temporarily closed for renovation.
Major Tourist Attraction/Destination Annual Tourist Arrival
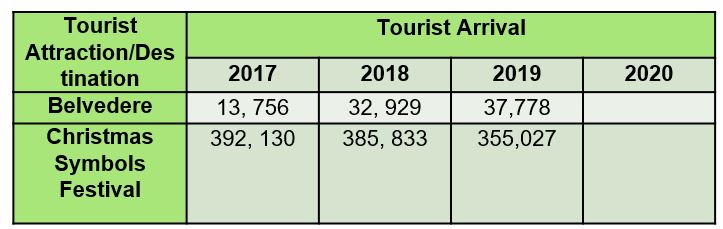
For the LGU manage tourism destination – the Belvedere, there is an increase of tourism arrivals from 2017 to 2019. On the other hand, somehow a small decrease of arrivals in Christmas Symbols Festival as recorded may result from unfavorable weather events (2 Typhoon & 2 LPA – Source: google.com) and restraining tourists from neighboring city/municipalities and provinces to visit.
Tourist Attractions/Destinations Annual Income
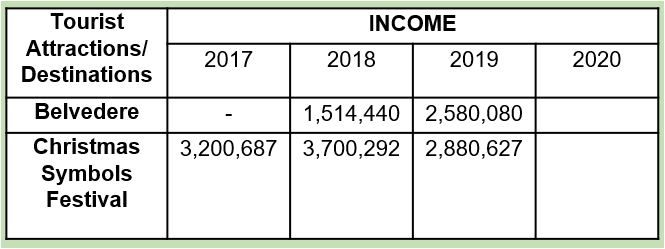
In effect of decrease in tourism arrival there is also a decrease in income of the tourism industry. However, this does not hampered the operation of a nature tourism and tourism events just for the people to experience the love of Tangubanon to our people, our environment and our culture.
This income of the LGU managed tourism sites will be utilize for further beautification, improvement and protection and conservation of tourism in the city.
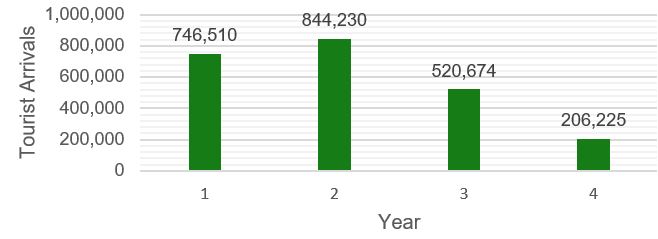
Projected Tourist Arrivals
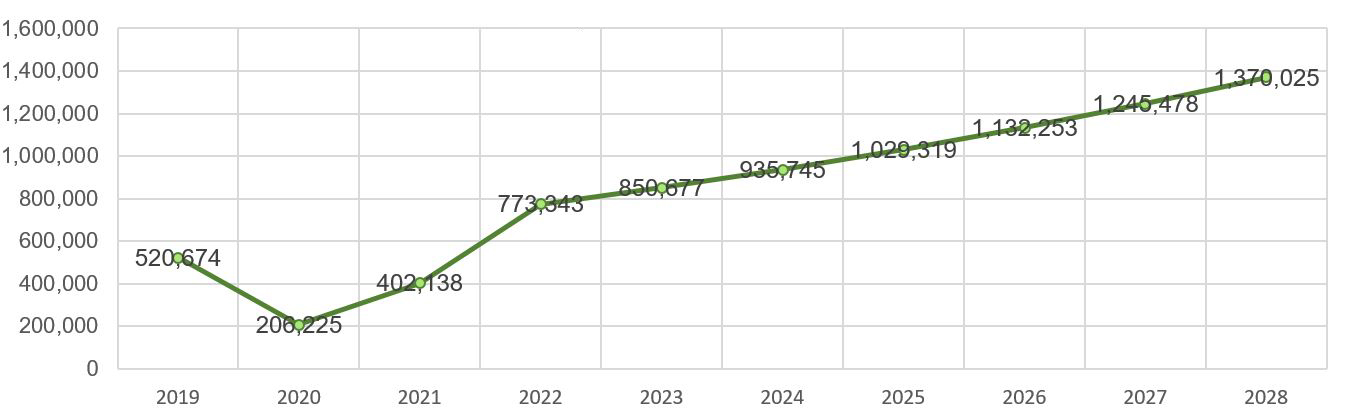
COVID-19 outbreak greatly impacts the Tourism Industry. Tourism is among the most affected sectors with a massive fall in tourist arrivals from 520, 674 in 2019 to 206, 225 in 2020.
Looking ahead, tourist arrivals are expected to increase by 94% in 2021, based on the assumption of a gradual reversal of the pandemic, the launch of the COVID-19 vaccine and the lifting of travel restrictions by the middle of the year. An increase of 50% is also expected in 2022 due to the high pent-up demand after months of closed borders and travel bans. Furthermore, an increase of 10% is also predicted to continue in 2023 to 2028 as travel conditions normalize and the pandemic is contained globally.
Office Hours
Monday - Friday
8:00 am - 5:00 pm
(except holidays)
Email: cgo.tangubcity@gmail.com
Address
Barangay 1, Tangub City
Misamis Occidental 7214
Philippines
Follow Us

